Good news for wages and Social Security tax base, but will costs stay flat?
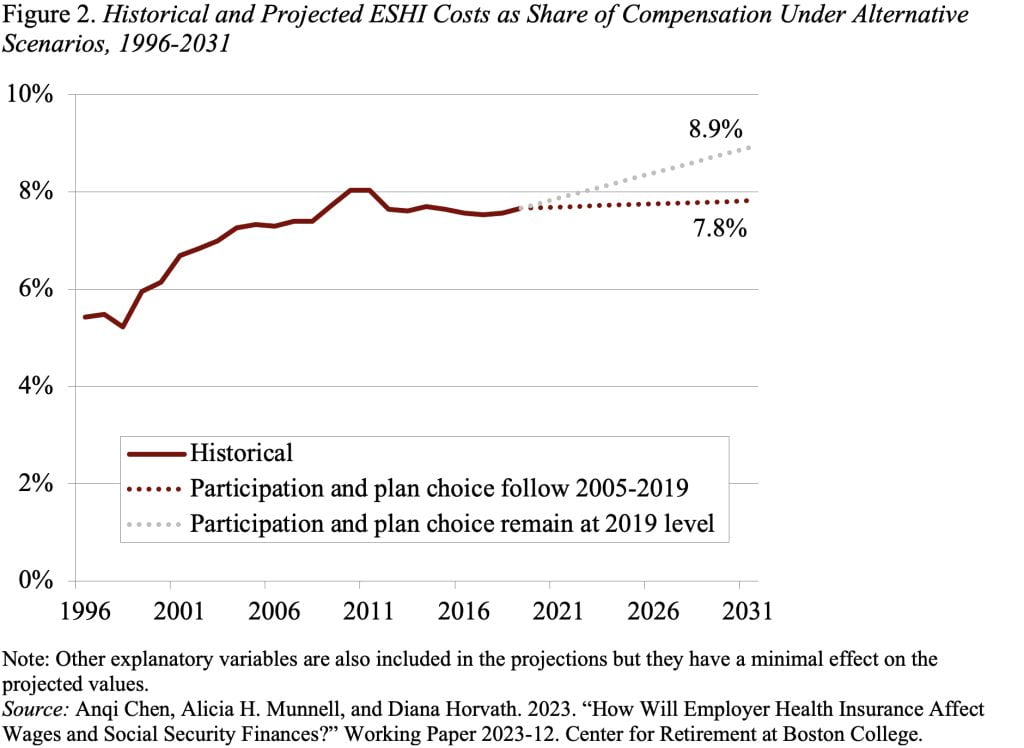
Health care costs are a large and growing share of the nation’s GDP. One way those costs feed into the general economy is through employer contributions to employer-sponsored health insurance (ESHI). Economists generally assume that the costs of employer benefits – in this case health insurance – are passed onto the employee, leading to slower wage growth and thereby the erosion of the Social Security wage base. Both these effects were evident in the decades before 2005, as ESHI increased as a share of compensation. Fortunately, the ratio of ESHI contributions to compensation plateaued after 2005, stabilizing wages and halting the erosion of the share of labor compensation subject to Social Security’s taxable base (see Figure 1).
The question is whether the stabilization of employer contributions as a share of compensation is temporary or permanent. To answer that question my co-authors and I set out to determine why ESHI contributions rose as a share of compensation prior to 2005 and why this ratio stabilized in recent years. We then used these findings to project possible ratios of ESHI to compensation over the next decade.
The literature identifies three major factors that drive the cost of ESHI as a share of compensation:
- National Health Expenditures: General trends in healthcare spending are, not surprisingly, an important driver. These expenditures increased from about 13 percent of GDP in the mid-1990s to around 17 percent of GDP in 2009, plateauing around this level through 2019.
- Makeup of Participants: Since the cost of health insurance as a percentage of compensation is higher for lower earners than for higher earners, a decline in participation among lower earners decreases the employer’s overall ratio of ESHI costs to compensation.
- Family vs. Individual Coverage: Family plans are substantially more expensive than individual plans, and their costs have grown at a faster pace. To the extent that family plans as a share of total plans declines, costs relative to compensation will drop.
Using data from Department of Health and Human Services’ Medical Expenditure Panel Survey (MEPS), our analysis showed that the growth in national health expenditures was, indeed, the major driver of the ESHI-to-compensation ratio both before and after 2005. After 2005, however, this impact was largely offset by the decline in participation among lower earners and the decline in demand for family plans.
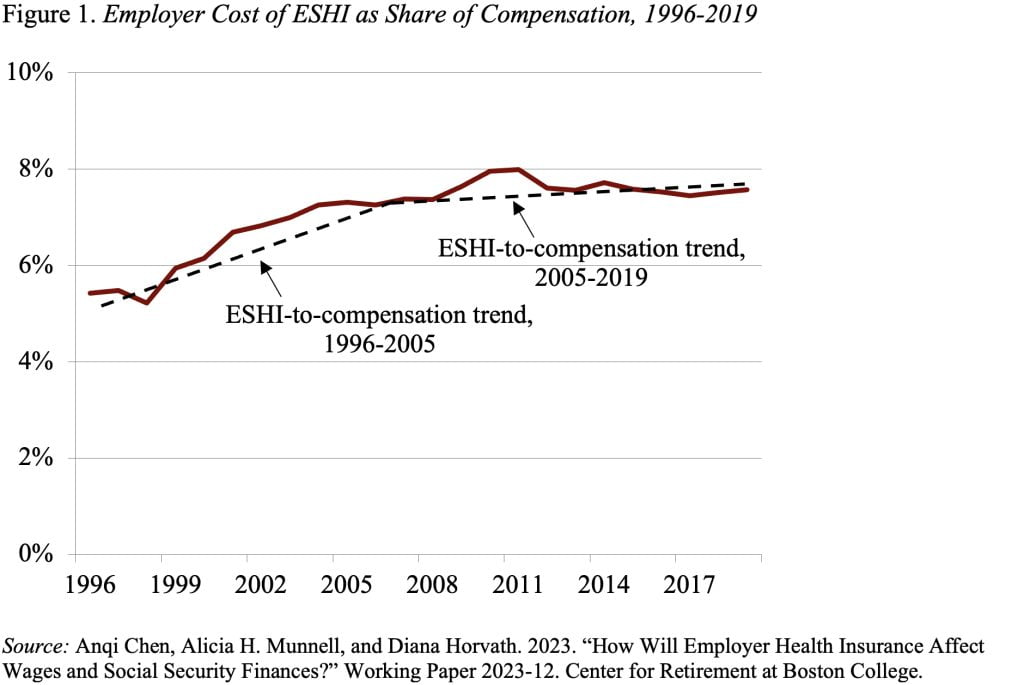
Looking forward, the Centers for Medicare & Medicaid Services project that national health expenditures as a percentage of GDP will increase from 17.6 percent in 2019 to 19.6 percent in 2031. If nothing else changes, ESHI as a share of compensation will increase as well. But, if ESHI participation and demand for family plans decline as they have in recent years, these two factors should offset the growth in healthcare expenditures and the ratio of ESHI to compensation should remain stable (see Figure 2).